Aggregate Queries in Seq Part 5: Execution
Part 5 was very nearly the stalling point in this blog series. I’ve got enough of the implementation done that I can see the finish line, and I’m eager to get that build out, but to really finish the story I need to fill in this installment. If this post is a little brief, please read it as a “status report” this time around :-)
I’ve also had a bit of time now to revisit decisions made in the earlier stages of building this feature. I had some honest and valuable feedback from Michael Chandler on Twitter regarding the “SQL-like” nature of the syntax:
@nblumhardt Just wondering if you can take more inspiration from elsewhere - maybe Lucene and RavenDB? Hybrid C#/SQL language is weird?
— Michael Chandler (@optiks) November 5, 2015
Upon reflection I think it will be easier to explain how to use aggregate queries if the language simply is SQL, or a dialect thereof, anyway. So, I’ve been back to rework some of the parser and now in addition to the C#-style expression syntax, typical SQL operators such as =, and, or, like, and not as well as single-quoted strings are available:
select count(*)
where Environment = 'production' and not has(@Exception)
group by time(7d), Application
There are still some questions to answer around how much this flows back the other way into typical filter expressions. On the one hand, it’d be nice if the filter syntax and the where clause syntax were identical so that translating between queries and filters is trivial. On the other hand, keeping the languages a bit tighter seems wise. For now, the syntaxes are the same; I’m going to spend some time using the SQL syntax in filters and see how it goes in practice.
Anyway, back to the topic at hand. Now we’re getting somewhere! The aggregate query parser handles the syntax, the planner can produce a query plan, and we need to turn that into a result set.
This post considers three questions:
-
What inputs are fed into the executor?
-
What does the result set look like?
-
How is the result computed?
The first turns out to be predictably easy, given the efforts expended so far to generate a plan, and the existing event storage infrastructure. Keeping things as simple as possible:
static class QueryExecutor
{
    public static QueryResult Execute(
        QueryPlan plan,
        IEventStore store,
        DateTime rangeStartUtc,
        DateTime rangeEndUtc)
Here plan is the output of the last step, store is a high-level interface to Seq’s time-ordered disk/RAM event storage, and the two range parameters the time slice to search. (The implementation as it stands includes a little more detail, but nothing significant.)
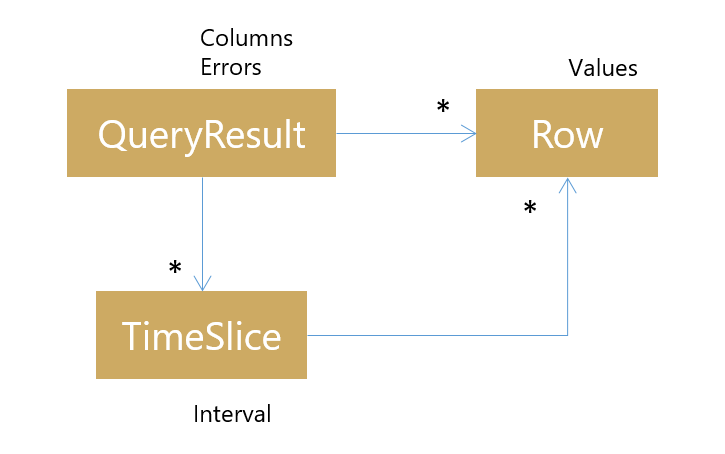
A QueryResult lists the column names produced, and either a list of rows, or a list of time slices that each carry a list of rows:

I decided for now to keep the concept of “time slice” or sample separate (time could simply have been another column in the rowset) because it makes for a friendlier API. I’m not sure if this decision will stick, since tabular result sets are ubiquitously popular, but when “series” are added as a first-class concept it is likely they’ll have their own more optimal representation too.
In between these two things – an input query plan and an output result – magic happens. No, just kidding actually. It’s funny how, once you start implementing something, the magic is stripped away and things that initially seem impenetrably complex are made up of simple components.
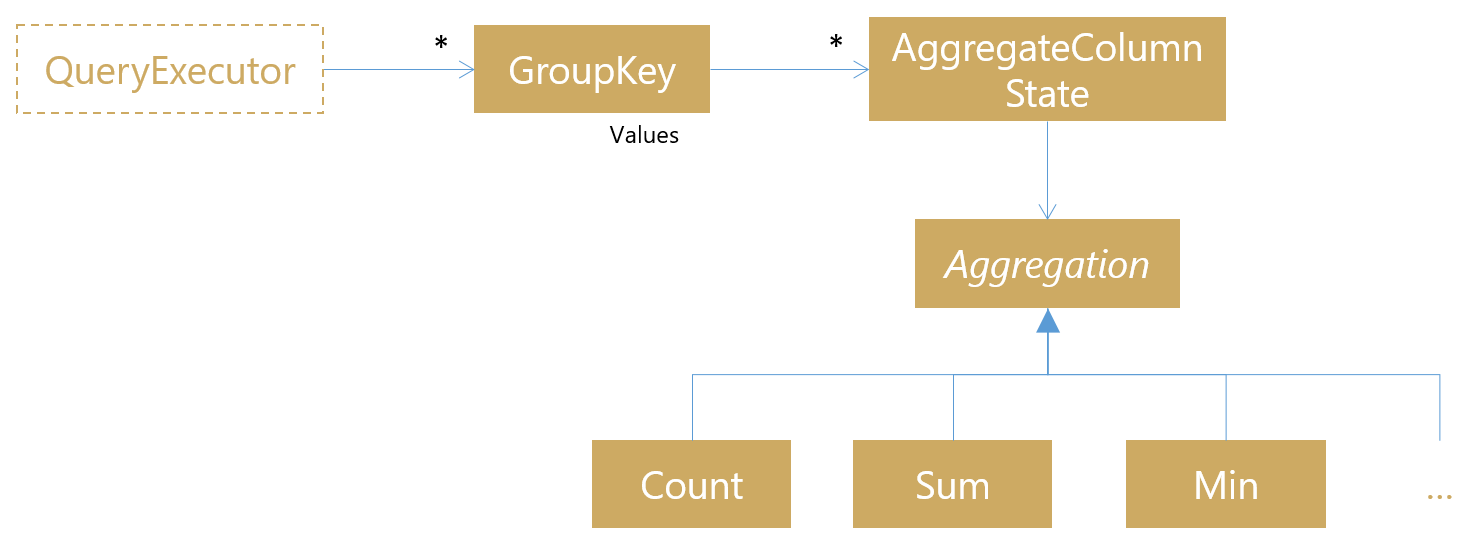
The core of the query executor inspects events one by one and feeds the matching ones into a data structure carrying the state of the computation:

First, the group that the event belongs to is determined by calculating each grouping expression and creating a group key. Against this, state is stored for each aggregate column being computed. The subclasses of Aggregation are themselves quite simple, like count():
class CountAggregation : Aggregation
{
    long _count;

    public override void Update(object value)
    {
        if (value == null)
            return;

        ++_count;
    }

    public override object Calculate()
    {
        return (decimal)_count;
    }
}
The value to be aggregated is passed to the Update() method (in the case of count(*) the * evaluates to a non-null constant) and the aggregation adds this to the internal state.
Once all of the events have been processed for a time range, Calculate() is used to determine the final value of the column. It’s not hard to map count(), sum(), min(), max() and so-on to this model.
Things are a little trickier for aggregates that themselves produce a rowset, like distinct(), but the basic approach is the same. (Considering all aggregate operators as producing a rowset would also work and produce a more general internal API, but the number of object[] allocations gets a little out of hand.)
Once results have been computed for a time slice, it’s possible to iterate over the groups that were created and output rows in the shape of the QueryResult structure shown earlier.
There’s obviously a lot of room for optimisation, but the goals of a feature spike are to “make it work” ahead of making it work fast, so this is where things will sit while I move on towards the UI.
One more thing is nagging at me here. How do we prevent an over-eager query from swamping the server? Eventually I’d like to be able to reject “silly” queries at the planning stage, but for now it’s got to be the job of the query executor to provide timeouts and cancellation. These are sitting in a Trello card waiting for attention…
In the next post (Part 6!) we’ll look more closely at Seq’s API and finally see some queries in action. Until then, happy logging!
