
From SerilogTimings to SerilogTracing
SerilogTimings is a handy little library that wraps blocks of code in “operations”:
using Serilog;
using SerilogTimings;

Log.Logger = new LoggerConfiguration()
    .WriteTo.Console()
    .CreateLogger();

using (Operation.Time("Say hello to {Name}", Environment.UserName))
{
    Log.Information("Hello!");

    using (var op = Operation.Begin("Measure temperature"))
    {
        // Attached to the log event but not shown in text output
        op.Complete("Temperature", 35);
    }
}
When an operation completes, either explicitly or by being disposed, SerilogTimings writes an event with the duration of the operation through Serilog:
[13:53:20 INF] Hello!
[13:53:20 INF] Measure temperature completed in 0.6 ms
[13:53:20 INF] Say hello to nblumhardt completed in 26.5 ms
SerilogTimings is simple, transparent, and gets its job done with a minimum of fuss. It hasn’t changed significantly in many years, now. So why this post? Timed operations show up absoultely everywhere, and so tooling has evolved to make working with them much more efficient.
Operations might be nothing more than an event with a duration attached, but by adding a handful of other correlation ids behind the scenes, collections of timed operations in a hierarchy become traces, and a whole range of tooling now exists that can visualize and manipulate them.
A new Serilog extension called SerilogTracing updates the SerilogTimings API to generate traces that interoperate with more tools and .NET libraries.
Here’s the equivalent of the above example, using SerilogTracing instead:
using Serilog;
using SerilogTracing;
using SerilogTracing.Expressions;

Log.Logger = new LoggerConfiguration()
    .WriteTo.Console(Formatters.CreateConsoleTextFormatter())
    .CreateLogger();

using (Log.Logger.StartActivity("Say hello to {Name}", Environment.UserName))
{
    Log.Information("Hello!");

    using (var op = Log.Logger.StartActivity("Measure temperature"))
    {
        op.AddProperty("Temperature", 35);
    }
}
The output at the console is similar:
[14:43:49 INF] │ Hello!
[14:43:49 INF] ├ Measure temperature (0.487 ms)
[14:43:49 INF] └─ Say hello to nblumhardt (19.015 ms)can
But by writing to a tracing-enabled sink, the result can now also be visualized in Seq, Zipkin, and many other tools:
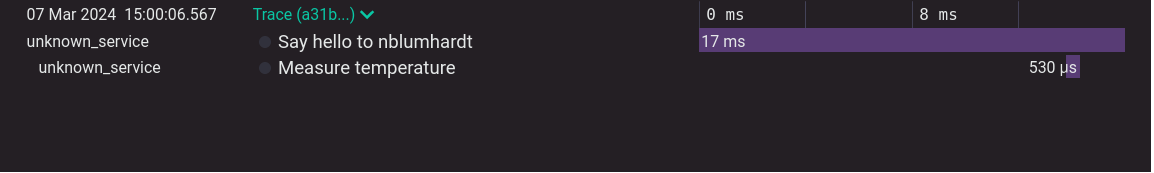
The image above uses WriteTo.Seq() and Seq 2024.1. Wider sink support is listed in the SerilogTracing README.
Along with trace visualization, SerilogTracing integrates with System.Diagnostics so that HTTP requests, database operations, and pretty much any instrumented .NET activity will be automatically traced.
API conversion
SerilogTracing’s ILogger.BeginOperation() and ILogger.TimeOperation() are both covered by SerilogTracing’s ILogger.StartActivity().
Unlike SerilogTimings, SerilogTracing doesn’t provide a static wrapper around the Serilog Log class, so Operation.Begin() and Operation.Time() map to the same ILogger.StartActivity() extension method, which needs to be called on Log.Logger directly.
The SerilogTracing API for completing operations is separate from adding properties: instead of passing properties to Complete(), you explicitly complete a SerilogTracing activity using Complete(level, exception), or add properties using AddProperty().
Formatting conversion
The example above uses Formatters.CreateConsoleTextFormatter() from the SerilogTracing.Expressions NuGet package to add timings to console output. If you want to customize how spans are output, or match SerilogTimings more closely, there’s a template in the SerilogTracing README that you can modify to achieve this.
The future
SerilogTimings is not dead, but it’s done. If you’re interested in improving how your application exposes timing information, SerilogTracing is the natural successor to SerilogTimings, and opens up a range of interesting new possibilities.