
SerilogTracing
TL:DR: Check out SerilogTracing, a simple, minimal extension for Serilog that integrates with
System.Diagnostics.Activityto provide hierarchical, distributed traces and compatibility with the Serilog sink ecosystem.
Traces are amazing for analyzing performance and for describing complex operations that flow across multiple systems. Modern .NET has tracing support built-in, so it’s now surprisingly easy to generate and consume traces with all of the hierarchical, distributed goodness provided for free by the framework.
SerilogTracing is a new project that handles the mechanics of:
- Creating beautiful, clean, fully-structured traces using the message template syntax that Serilog users will know and love, and
- Getting traces out into tracing systems, log files, the terminal, and any other place a Serilog sink can reach.
And because it’s built on the same tracing APIs as the rest of .NET, it can hope to interoperate with whatever other tracing or diagnostic infrastructure you might wish to use, now or in the future.
This post is a summary of what you can expect from SerilogTracing, but the best examples to get started with are in the SerilogTracing README, which includes detailed instructions.
Creating beautiful traces
A trace is made up of one or more spans, which are generally represented using activities in .NET.
You wrap an activity around some meaninful piece of work using Serilog.ILogger.StartActivity() and a using statement:
using var activity = _log.StartActivity("Fulfill order {OrderId}", order.Id);
// ... some application logic ...
When the activity is disposed or Complete() is called, a span will be written through the logger.
The first thing you’ll notice is that StartActivity() names the span using a message template. Any property values captured by the message template will be attached to the activity, so in this case, the span will carry an OrderId property.
If you’ve used Serilog previously, this will be familiar. Message templates are a powerful way to pack a low-cardinality event type (the template itself), a high-cardinality formatted message, and multiple fully-structured properties, all into a single, clean, readable line of code.
Locally, you get nicely-presented terminal output:
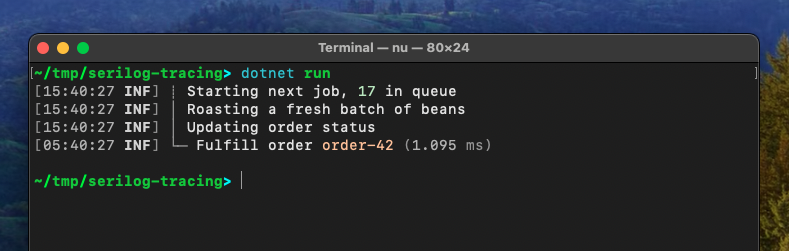
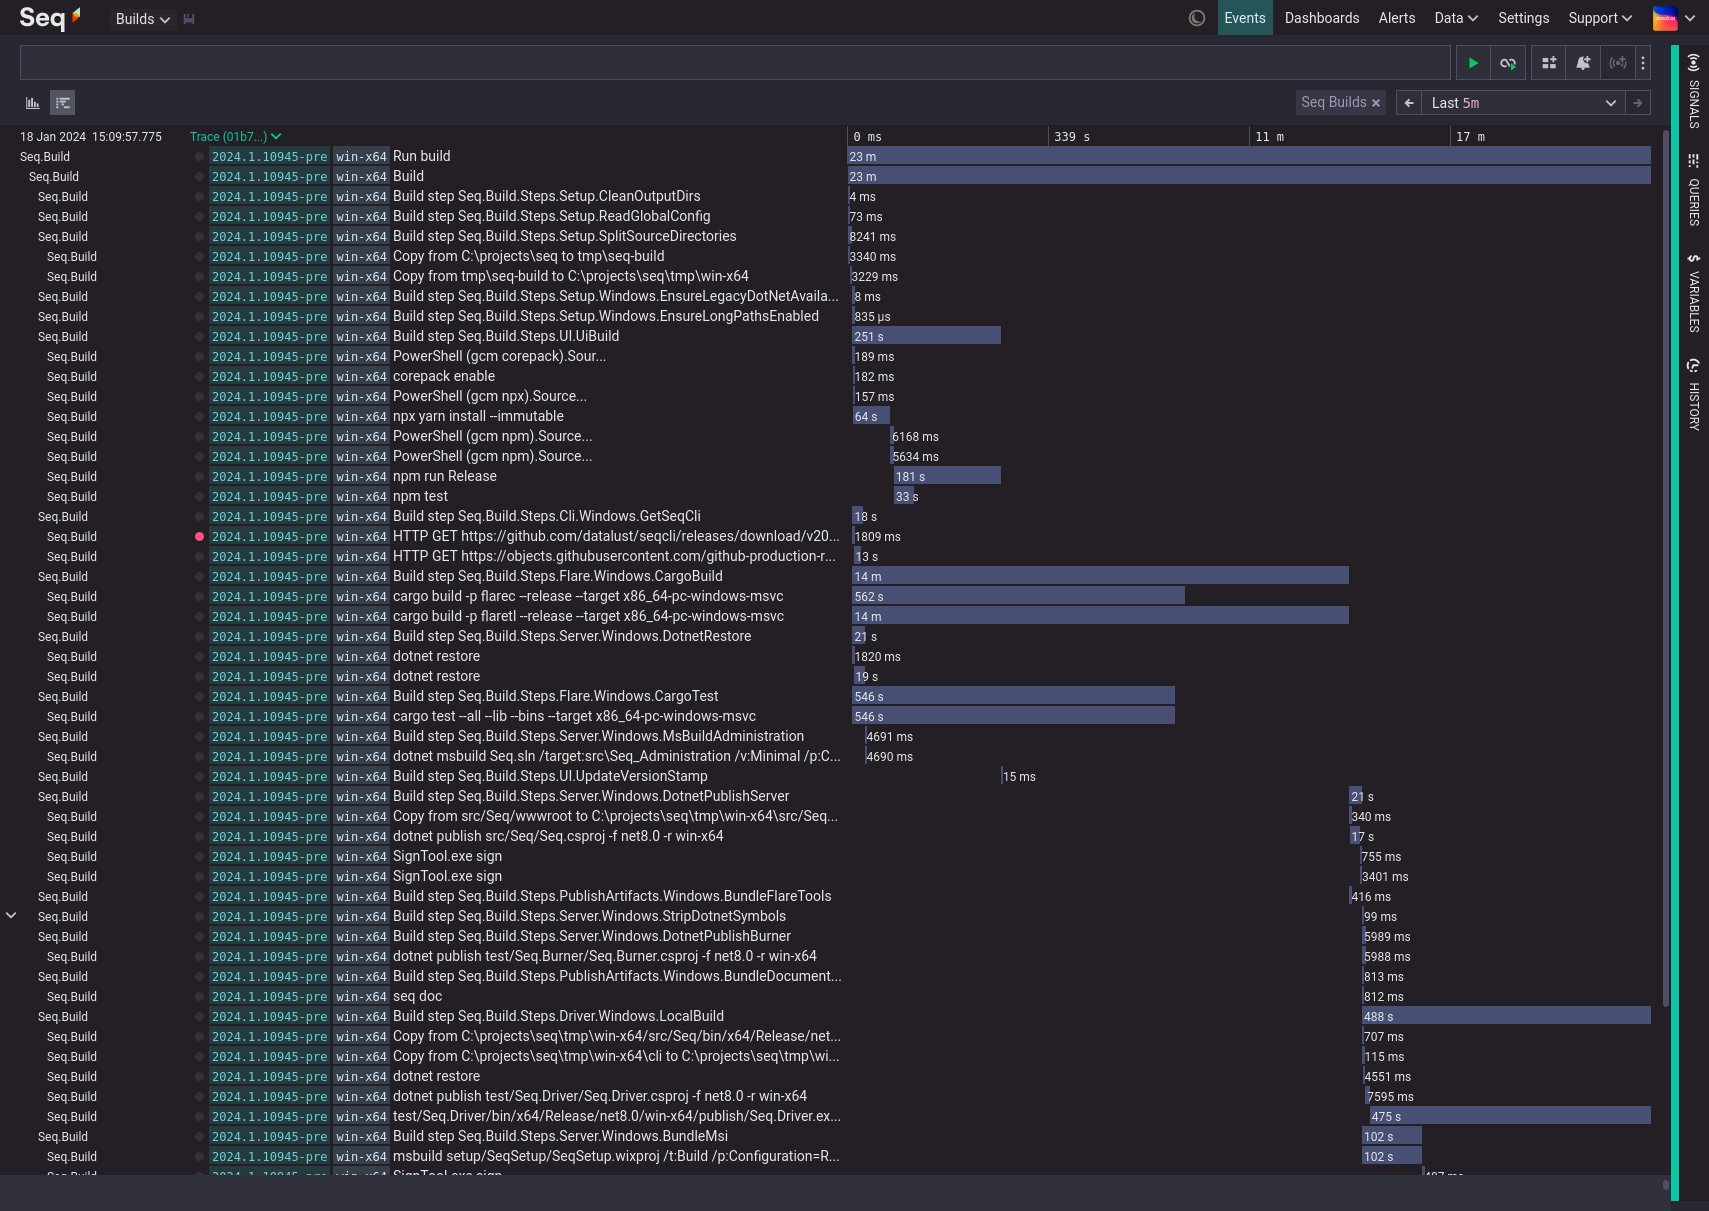
And, you can choose to send any combination of the template, the formatted message, and the structured properties to your tracing system, depending on what works best for you there.
Getting traces out
To get started, any Serilog sink will do! Traces are just collections of spans, and SerilogTracing represents spans as log events. This means that you can start instrumenting your code with tracing while logging to nothing more complex than a text file or the terminal.
// A very minimal configuration ...
Log.Logger = new LoggerConfiguration()
    .WriteTo.Console()
    .CreateLogger();

// ... is still enough to start tracing.
using var activity = Log.Logger.StartActivity(...);
But, there are two things you’ll need to do if you want to view your spans in a hierarchy, or participate in distributed tracing.
Consume external activities
The first is to subscribe to activities created by other .NET components. This is important because the code generating these activities is also responsible for distributed trace propagation, and if no subscribers are listening, they won’t bother propagating important identifiers such as the incoming trace and parent span ids.
using var _ = new ActivityListenerConfiguration().TraceToSharedLogger();
If you’re working on the server-side, check out the instructions for adding ASP.NET Core instrumentation here, too.
Install some tracing-enabled sinks
Spans are just LogEvents, but a handful of conventions make it possible to render them as traces if you have a suitable back-end available.
In particular, the SpanStartTimestamp and ParenSpanId properties are enough to drive hierarchical trace visualization. The included Zipkin sink handles spans only (it ignores other events), and manages this in just a few dozen lines of interesting code.
Right now, unless you’re using Seq, Zipkin, or a back-end that supports OTLP, chances are you’ll need to modify an existing Serilog sink to recognize these properties: if you do, please reach out, I’m interested to hear how you go, and keen to help where I can.
The pitch!
So to wrap this whole thing up, the pitch for SerilogTracing comes down to:
- Keep your existing Serilog logging unchanged
- Generate rich spans with a single line of code each
- Subscribe to spans from other .NET components with a single line of code at startup
- Participate in distributed tracing and
traceparentpropagation thanks to .NET ❤️ - Send everything through Serilog’s enrichers, filters, and sinks
- See spans as structured log events in sinks that don’t support tracing
- See spans as traces in compatible sinks
To balance out this very rosy picture 😊 please remember that SerilogTracing is brand new, pre-1.0, and still under very active development.
And, it would be remiss of me not to mention that much of SerilogTracing has been designed and built by my colleagues Ashley and Liam at Datalust: hat tip to you both! 🎩
Instructions for getting started are in the README. I hope this is useful for you!
Edited 2024-02-23: updated the example to match the current type and method names.