
Setting up Serilog in ASP.NET Core 3
TL; DR: I’ve put down everything I can think of about getting set up for successful production diagnostics using Serilog and ASP.NET Core.
Out of the box, ASP.NET Core 3 comes with reasonable defaults for diagnostic logging: the framework and applications have access to good APIs for structured logging, and log events are written out to useful providers including the terminal and Microsoft’s Application Insights offering.

Serilog is an alternative logging implementation that plugs into ASP.NET Core. It supports the same structured logging APIs, and receives log events from the ASP.NET Core framework class libraries, but adds a stack of features that make it a more appealing choice for some kinds of apps and environments.
- Serilog’s vast ecosystem includes hundreds of integrations that cover everything from the basics like console and file logging, through databases, message queues and network protocols, all the way to popular log servers and SaaS log collectors
- Abundant blog posts, Stack Overflow Q&As, extension projects, and community know-how, mean that whatever surprising hurdles you need to clear, whether it’s round-tripping events to JSON, routing events by property value, dynamic filtering, integration with some pre-existing framework, and so-on, chances are someone has been there first and you can benefit from their experience
- Serilog’s control over how events are captured and enriched means that it can be finely-tuned to record just the right information for optimal diagnostics
- The “big picture” capabilities, like seamless switching between plain-text and JSON output, are all covered, but so are the little details — like carefully-crafted output formats, or selectable terminal colour schemes
Serilog is also independent of .NET Core and most of the framework infrastructure (including configuration and dependency injection), making it well-suited to collecting and recording problems with starting up the framework itself, which is a critical role for a logging library.
This is an opinionated guide to setting up Serilog in ASP.NET Core 3 applications. It’s not the only way to go about it, but this should set you on a path to the pit-of-success. Good luck!
Getting started
We’re going to start with a fresh ASP.NET Core MVC application. I’ll show each step here using the dotnet command-line, but you can equally well use Visual Studio’s File > New Project experience and GUI package manager if you prefer those.
# Make sure this prints a 3.x version number; if not,
# you'll need to install the latest .NET Core SDK
dotnet --version
mkdir Example
cd Example
dotnet new mvc
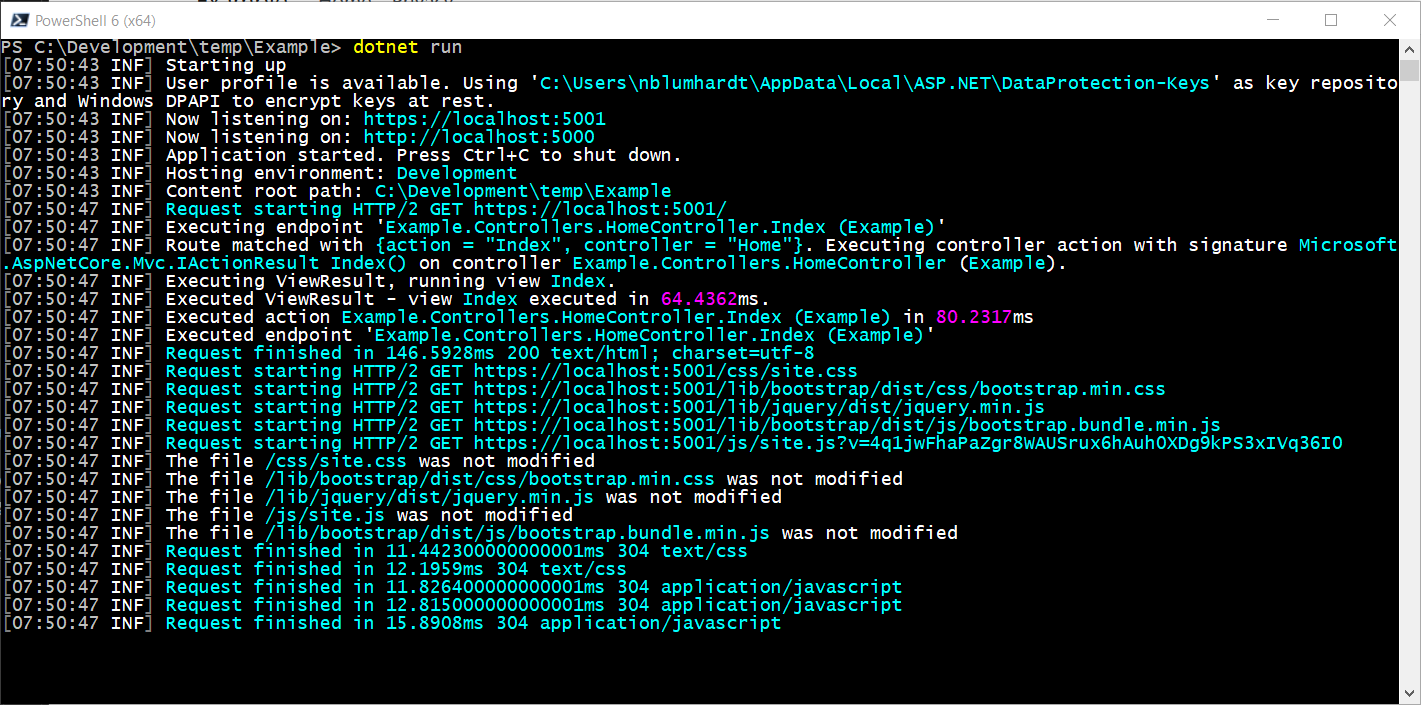
dotnet run
The final command should start the app listening at http://localhost:5000. Open it up in your web browser and watch logs being printed to the terminal. Nice! Ctrl+C will shut everything down again and leave us ready to move forward.
The Serilog.AspNetCore package
You can install just about everything you need via one package, Serilog.AspNetCore:
dotnet add package Serilog.AspNetCore
Logger initialization in Program.cs
Here’s the Program class generated by the dotnet new mvc scaffolding, with the copious using statements elided for brevity:
public class Program
{
    public static void Main(string[] args)
    {
        CreateHostBuilder(args).Build().Run();
    }

    public static IHostBuilder CreateHostBuilder(string[] args) =>
        Host.CreateDefaultBuilder(args)
            .ConfigureWebHostDefaults(webBuilder =>
            {
                webBuilder.UseStartup<Startup>();
            });
}
Initialization and the top-level try/catch block
Exceptions thrown during start-up are some of the most disruptive errors your application might face, and so the very first line of code in our Serilog-enabled app will set up logging and make sure any nasties are caught and recorded.
The Serilog types are in the Serilog namespace, so at the top of Program.cs we need:
using Serilog;
Here’s the updated Main() method:
    public static void Main(string[] args)
    {
        Log.Logger = new LoggerConfiguration()
            .Enrich.FromLogContext()
            .WriteTo.Console()
            .CreateLogger();

        try
        {
            Log.Information("Starting up");
            CreateHostBuilder(args).Build().Run();
        }
        catch (Exception ex)
        {
            Log.Fatal(ex, "Application start-up failed");
        }
        finally
        {
            Log.CloseAndFlush();
        }
    }
The Serilog configuration above is fairly self-explanatory. I’ve added Enrich.FromLogContext() to the logger configuration since we’ll use its features later on, and forgetting to enable it is a frequent cause for head-scratching when events are missing expected properties like RequestId.
Plugging into ASP.NET Core with UseSerilog()
If you run the application now, you’ll see Serilog’s and ASP.NET Core’s log output side-by-side. Our goal is to have all log events processed through the same (Serilog) logging pipeline, and to do that we add UsingSerilog() into Program.cs’s CreateHostBuilder() method:
    public static IHostBuilder CreateHostBuilder(string[] args) =>
        Host.CreateDefaultBuilder(args)
            .UseSerilog() // <- Add this line
            .ConfigureWebHostDefaults(webBuilder =>
            {
                webBuilder.UseStartup<Startup>();
            });
Important: Serilog in ASP.NET Core 3 plugs into the generic host and not webBuilder.
That’s it! If you dotnet run you’ll now see clean, consistent, Serilog output:
Cleaning up remnants of the default logger
There are a few spots in the application that traces of the default logger might remain. Serilog completely replaces the logging implementation on .NET Core: it’s not just a provider that works side-by-side with the built-in logging, but rather, an alternative implementation of the .NET Core logging APIs. The benefit of this is that you’re not running two different logging frameworks with tricky edge cases where they overlap in functionality.
The "Logging" section that you’ll find in appSettings.json isn’t used by Serilog, and can be removed:
{
  "Logging": {
    "LogLevel": {
      "Default": "Information",
      "Microsoft": "Warning",
      "Microsoft.Hosting.Lifetime": "Information"
    }
  },
  "AllowedHosts": "*"
}
After cleaning up here (and in appSettings.Development.json), the configuration looks like this:
{
  "AllowedHosts": "*"
}
If you do need JSON configuration support, Serilog has this covered with Serilog.Settings.Configuration and the "Serilog" section. We’ll talk more about that approach further on.
If you find any remaining references to APIs like ILoggingBuilder and AddLogging(), you can remove those, too.
Writing your own log events
In Program.cs, we used Serilog’s Log class directly to write events like Starting up. This works well in ASP.NET Core apps, and I encourage you to use standard Serilog interfaces like Log, ILogger, and LogContext if they meet your needs.
Alternatively, your app can consume the ILogger<T> interface from the framework via dependency injection. Serilog implements this interface, so the results are identical for practical purposes.
Here’s Hello, world! for 2019: the HomeController class generated by dotnet new mvc already includes an ILogger<T> field pre-configured, so we can call that in action methods such as Index(), and have events written through Serilog:
public class HomeController : Controller
{
    private readonly ILogger<HomeController> _logger;

    public HomeController(ILogger<HomeController> logger)
    {
        _logger = logger;
    }

    public IActionResult Index([FromQuery] string name)
    {
        _logger.LogInformation("Hello, {Name}!", name);
        return View();
    }
Appending ?name=world to the application URL will produce the usual output 😎.
Recording structured logs
The logs now produced by the app leave a lot of room for improvement, which we’ll tackle in the next section. Before we go on, though, it’s useful to see the underlying key/value properties associated with each log event, since these play a big part in real-world diagnostics.
Structured logs can be captured as easily as specifying a formatter for console output:
            // Back in Program.Main():
            .WriteTo.Console(new RenderedCompactJsonFormatter())
Or by adding a file sink with similar configuration:
.WriteTo.File(new RenderedCompactJsonFormatter(), "/logs/log.ndjson")
These options suit many environments, but the syntactically-noisy JSON output doesn’t make for good blog post examples, and isn’t the nicest format to use without further tools.
I work at Datalust on Seq, which is a self-hosted, web-based log server that works nicely with ASP.NET Core and Serilog. We’ll use that in the remaining examples, but you should pick the log server that your company uses in production, if that’s something else.
First, assuming you have docker installed, spin up a temporary Seq instance in another terminal window:
docker run --rm -it -e ACCEPT_EULA=Y -p 5341:80 datalust/seq
This will start Seq with ephemeral storage, listening at http://localhost:5341. Windows users can alternatively grab the Seq MSI and install an instance with that.
Adding a sink to record structured events
So far, we’ve seen WriteTo.Console() and WriteTo.File(), both of which are available through the Serilog.AspNetCore package. Other log outputs like Seq are distributed via NuGet in additional packages.
The Seq sink can be installed with:
dotnet add package Serilog.Sinks.Seq
Back in Program.cs, add WriteTo.Seq() into the logger configuration:
        Log.Logger = new LoggerConfiguration()
            .Enrich.FromLogContext()
            .WriteTo.Console()
            .WriteTo.Seq("http://localhost:5341") // <- Added
            .CreateLogger();
Environment-specific sink configuration
You’ll notice in the snippet above, the URL of the Seq server is hard-coded. URLs, API keys, etc. will commonly vary between your local development environment, and your app’s staging or production environments.
I mentioned earlier on that Serilog can read settings from appSettings.json. I want to spend a few moments convincing you that it’s not the best place for environment-specific configuration like this.
First, the appSettings.json configuration system isn’t available until some time into the execution of CreateHostBuilder(), and this would cause us to delay setting up the logger, potentially missing out on those all-important startup errors.
It’s possible to set up the configuration system early, and this is shown in one of the Serilog.AspNetCore examples, but this still leaves us suceptible to problems with reading that configuration at runtime: missing configuration files, broken JSON syntax, assembly loading issues, and so-on.
You’re probably detecting a theme by now. Logging setup should be absolutely bullet-proof, as early as possible, and therefore dependency-free.
Here’s how:
            .WriteTo.Seq(
                Environment.GetEnvironmentVariable("SEQ_URL") ?? "http://localhost:5341")
All we’re now dependent upon is having an environment variable, SEQ_URL in this case, set correctly in production. This doesn’t scale well to large amounts of configuration (that’s why Microsoft.Extensions.Configuration, and appSettings.json, exist), but for the handful of settings needed to get logging bootstrapped, it’s perfect.
There are a few more questions you might have about this:
- What about controlling the minimum logging level at runtime? — YAGNI, you ain’t gonna need it! This might sound like heresy: switching levels from, say,
InformationtoDebugat runtime was once considered bread-and-butter logging functionality, but here’s the catch. Are you really brave enough to turn on debug logging in production, burning unquantified CPU cycles, network bandwidth, and disk? Not a good idea. Debug logging can be turned on in the lab or on a developer machine, but it’s so far down the list of “good things to do in prod” that I am comfortable leaving it out. Going the other way,InformationtoWarningorError, is like driving blindfolded, and not something worth spending time worrying about either, for me. Log output should be tuned during development: there’s no case for throwing poorly-configured logging over the wall into production and sorting it out there. - What about adding sinks for different environments? — It’s easy enough to use
if()and environment variables to choose between pre-configured sinks in code, if you’re in a situation where this is required. Since the quality of log data relies heavily upon it being used realistically in development and test, it’s better to try standardizing on one or two log collection mechanisms right through from development to production, if you can. - What about changing logging configuration without redeploying? — So, fiddling with configuration files in notepad over RDP is rarely a good idea. With continuous integration, and an automated deployment system (like Octopus Deploy!) to make deployment of fully-tested code changes quick and easy, this can be avoided.
What do structured logs look like?
I’m a little uneasy about writing several hundred words in defence of one line of code, but let’s move on 😄.
Now that the Seq sink is configured, running the app and opening your browser at http://localhost:5341 will show the same log events, but in their entirety:
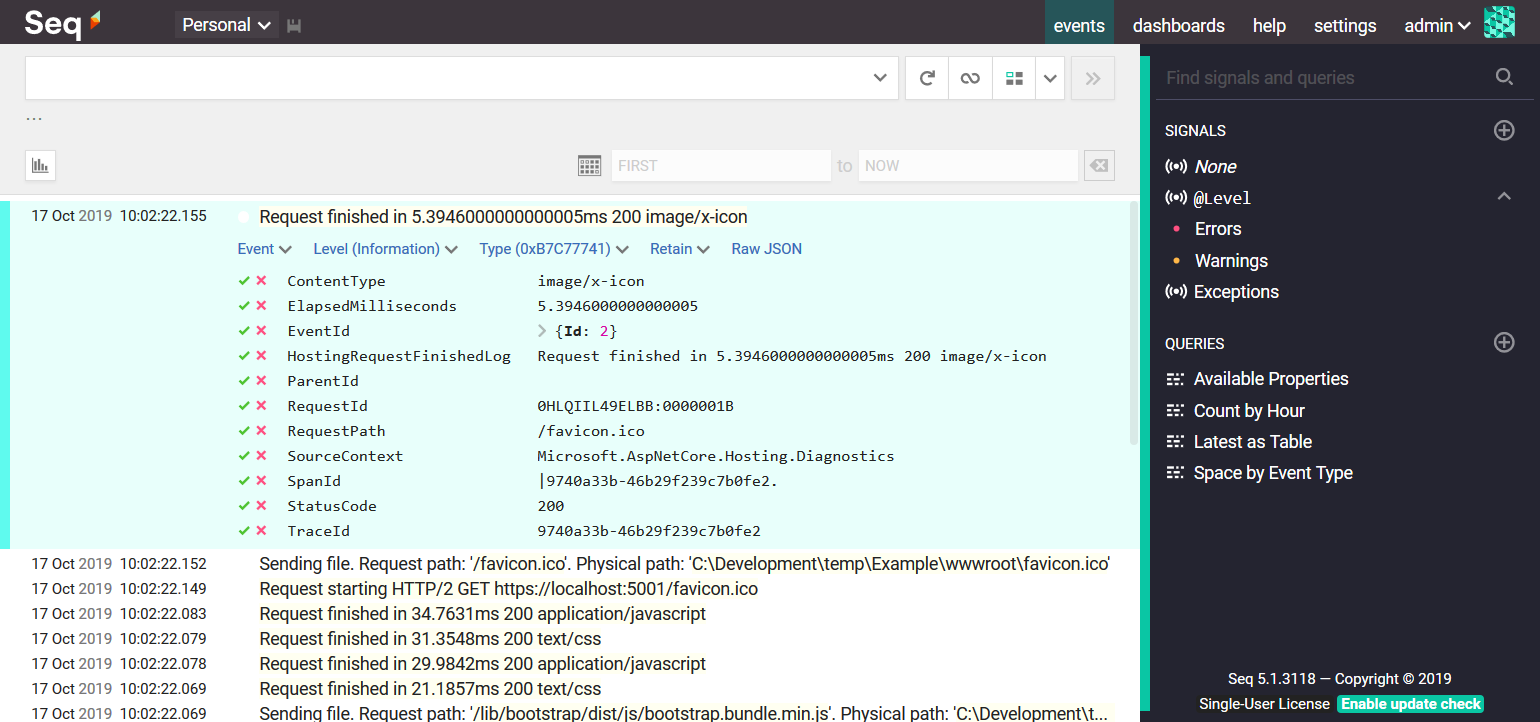
Clicking on an event to expand it, as I’ve done above, will show all of the information that ASP.NET Core is recording behind the scenes. Clicking on the green check-mark beside RequestId, and choosing Find, demonstrates the power of structured logging when dealing with a lot of log output.
Taking control of log output
Logs are an important interface to your application; they’re the “developer interface”, alongside the user interface, “data interface”, or programming interface. Just as we strive to create beautiful and functional pages, SQL schemas, or APIs, we should take ownership of our application’s log output and ensure it’s both usable and efficient.
Suppressing framework log noise
The first thing you’ll notice about the log output we’ve seen so far is that it’s very verbose. The ASP.NET Core framework writes events that describe its internal processes when routing and handling a request. We don’t usually want this level of detail for application diagnostics.
So, we’ll update Program.Main() and suppress information-level messages from ASP.NET Core components a level override:
        Log.Logger = new LoggerConfiguration()
            // `LogEventLevel` requires `using Serilog.Events;`
            .MinimumLevel.Override("Microsoft.AspNetCore", LogEventLevel.Warning)
            .Enrich.FromLogContext()
            .WriteTo.Console()
            .WriteTo.Seq(
                Environment.GetEnvironmentVariable("SEQ_URL") ?? "http://localhost:5341")
            .CreateLogger();
This means we’ll still see warnings and errors from the framework, but not informational log events.
Streamlined request logging
Our log output will now be rather quiet. We didn’t want a dozen log events per request, but chances are, we’ll need to know what requests the app is handling in order to do most diagnostic analysis.
To switch request logging back on, we’ll add Serilog to the app’s middleware pipeline over in Startup.cs. You’ll find a Configure() method in there like the following:
    public void Configure(IApplicationBuilder app, IWebHostEnvironment env)
    {
        if (env.IsDevelopment())
        {
            app.UseDeveloperExceptionPage();
        }
        else
        {
            app.UseExceptionHandler("/Home/Error");
            app.UseHsts();
        }
        app.UseHttpsRedirection();
        app.UseStaticFiles();

        // Add this line; you'll need `using Serilog;` up the top, too
        app.UseSerilogRequestLogging();

        app.UseRouting();

        app.UseAuthorization();

        app.UseEndpoints(endpoints =>
        {
            endpoints.MapControllerRoute(
                name: "default",
                pattern: "{controller=Home}/{action=Index}/{id?}");
        });
    }
We’ll be a bit tactical about where we add Serilog into the pipeline. I tend not to want request logging for static files, so I add UseSerilogRequestLogging() later in the pipeline, as shown above.
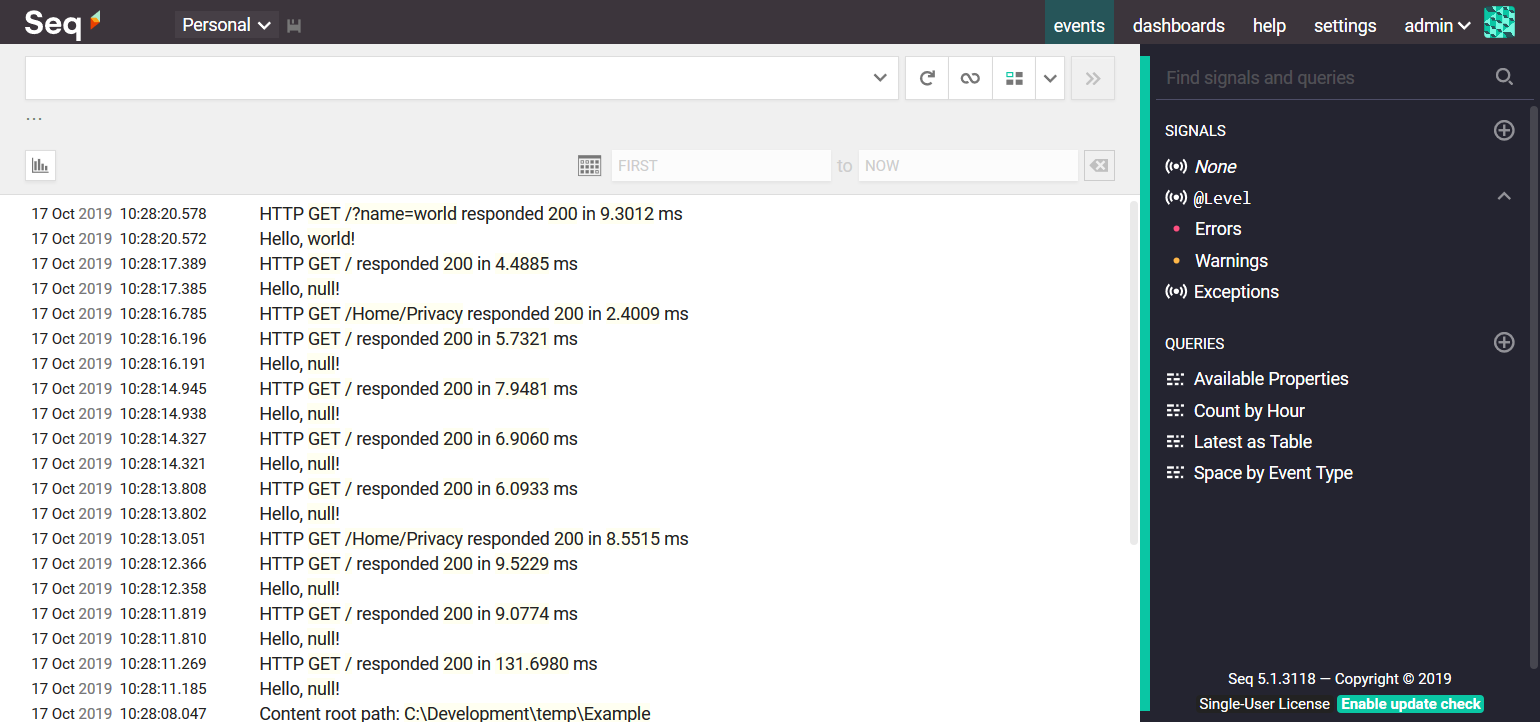
The resulting logs are much quieter, and because important properties like the request path, response status code, and timing information are on the same event, it’s much easier to do log analysis.
Learning more and getting help
There’s a lot more to learn about Serilog in ASP.NET Core 3.
In particular, check out the Serilog.AspNetCore README, which has details on some features like IDiagnosticContext and LoggerProviderCollection that I wanted to mention, but didn’t have space to write about here. The project repository also contains some example applications much like the one we’ve been using in this post.
You can find out more about Seq in the Seq documentation, which has setup instructions for Windows and Docker, as well as detailed information on log searches and analysis, event forwarding, and dashboarding and alerting from structured log data.
If you haven’t used Serilog much, the README in the Serilog GitHub project is a useful starting point, with links to wiki pages, discussion channels, etc.
I’ll try to field questions about the contents of this post here, but for general Serilog help, Stack Overflow’s serilog tag is the place to go.
Did I miss anything important? Let me know in the comments 😊!