
Runtime analysis and leak detection for Autofac
IoC containers like Autofac are magic when they quietly do their job; but, when they don’t behave as intended, they can be maddeningly opaque.
Autofac.Analysis is the latest incarnation of a project I’ve had in the works for a long, long time. Its primary purpose is to reliably detect Autofac usage problems at runtime: notably, it can spot the dreaded IDisposable component “memory leak” bug that still trips up people who are new to how Autofac works.
Along with that, Autofac.Analysis offers a glimpse into the hidden life of the IoC container running at the core of your app. What’s that thing actually doing in there? Find out:
1. Install the Autofac.Analysis module
On the application side, you need to hook Autofac.Analysis into your ContainerBuilder, and give it somewhere to send events. The analyzer doesn’t have a UI, but instead writes events through a Serilog logger.
We’ll start by installing a package or two:
dotnet add package Autofac.Analysis
dotnet add package Serilog.Sinks.Seq
Even if you’re using Serilog in the rest of your application, you might want to set up a separate logging pipeline for this, because a little bit of nonstandard configuration is needed:
// using Serilog;
var logger = new LoggerConfiguration()
    .Destructure.ToMaximumDepth(100)
    .WriteTo.Seq("http://localhost:5341")
    .CreateLogger();
Destructure.ToMaximumDepth(100) lets us log some deeper object graphs than might normally be sensible :-)
Slicing and dicing the events is made easier by a structure log server like Seq - you can just as easily log them to a JSON file or some other log server if you like.
If you don’t have Seq running locally, it’s:
docker run --rm -it -e ACCEPT_EULA=Y -p 5341:80 datalust/seq
… and open a web browser on http://localhost:5341.
Next, register the module with the ContainerBuilder you use to configure Autofac:
// using Autofac;
// using Autofac.Analysis;
var builder = new ContainerBuilder();

#if DEBUG
builder.RegisterModule(new AnalysisModule(logger));
#endif

// Other registrations...
I’ve added some #if DEBUG conditional compilation directives just to remind you that you probably don’t want to run this day-to-day in production: it’s very likely it will have a detrimental effect on application performance.
2. Run your application!
Here’s the fun part! Start up your app, click around, test things out. The goal is to exercise as much code as you can, since this will trigger Resolve() calls and feed events to the analyzer.
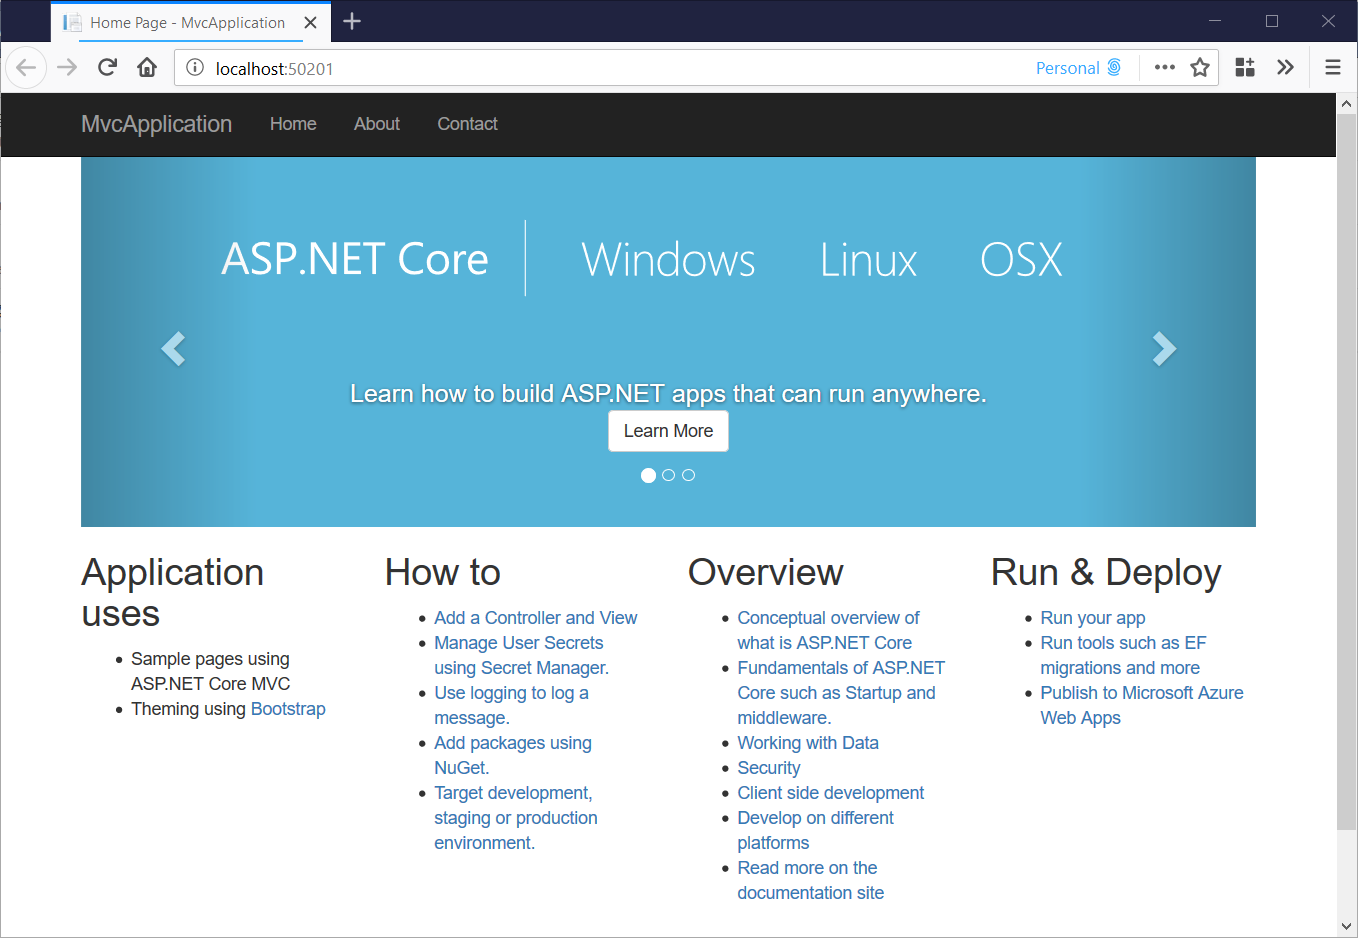
The sample app is just an ASP.NET Core MVC File > New Project web app with some dummy components thrown in. HomeController.Index() secretly sneaks a hundred tubes of toothpaste into the visitor’s shopping cart:
public class HomeController : Controller
{
    readonly ShoppingCartService _shoppingCartService;

    public HomeController(ShoppingCartService shoppingCartService)
    {
        _shoppingCartService = shoppingCartService;
    }

    public IActionResult Index()
    {
        _shoppingCartService.AddItem("toothpaste", 100);
        return View();
    }
It otherwise looks like the default ASP.NET Core app template.
3. Dig through the analysis
Here’s the … slightly less-fun part. If you refresh the Seq UI in your browser you should now see a pile of events:
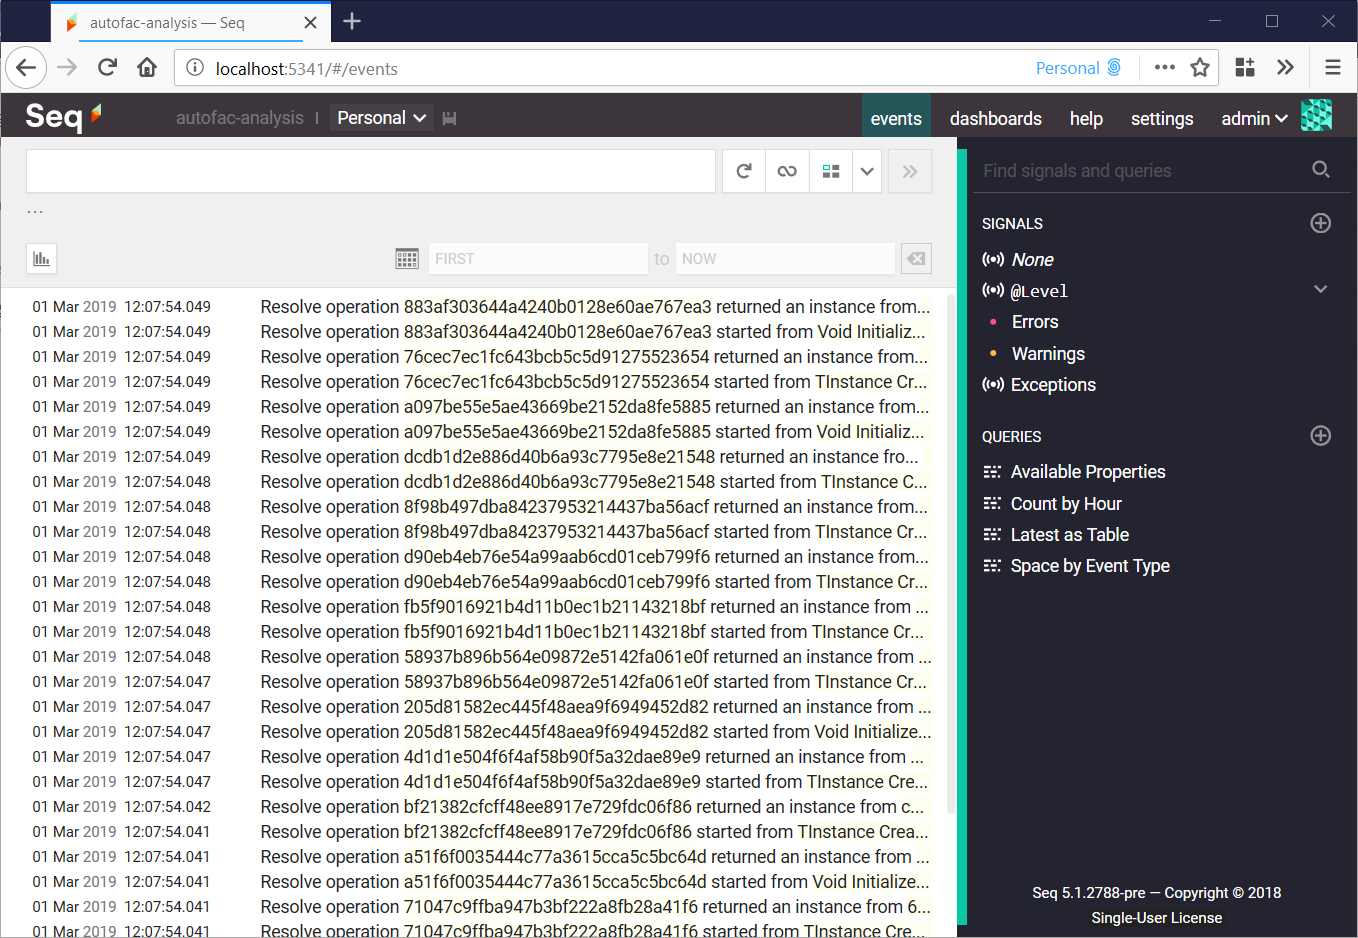
If you want to find information about a specific component, you can search for it by type name, but otherwise, select the Warnings and Errors signals in the right-hand bar to see whether the analyzer has picked up anything interesting.
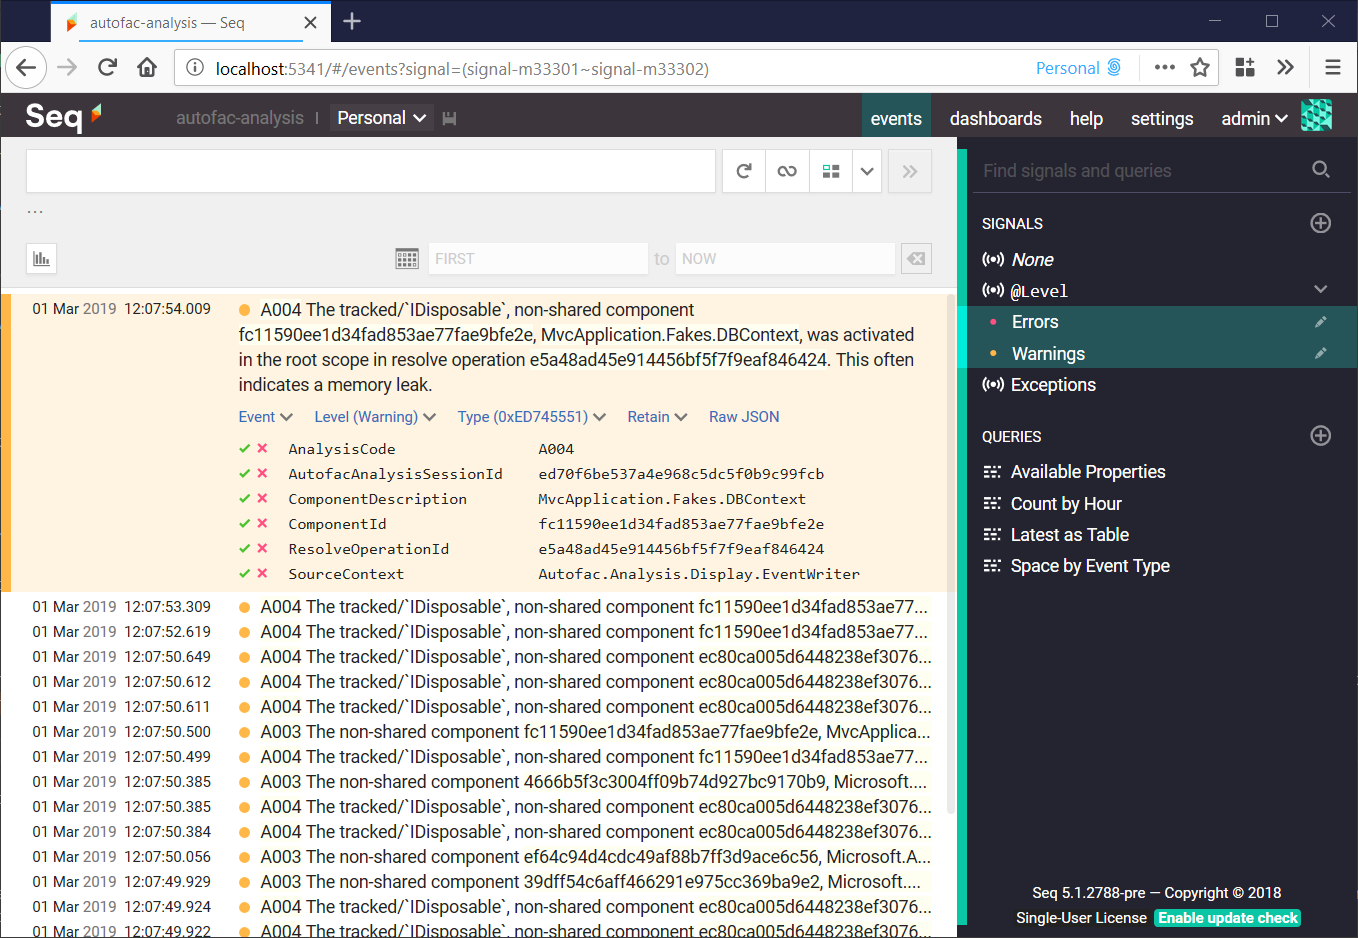
The analysis is fairly loose, and there are sure to be some false-positives. The most important event to look out for is A004, which I’ve expanded in the screenshot. This indicates a potential leak. If you find one, you can switch back to your application and run through the same sequence of actions, again. Does another, similar message, appear in the analysis log? If so - you’re probably onto something.
From the warning event, clicking the green checkmark next to the ComponentId property and selecting Find will give you more information about the component, and ResolveOperationId will give you more information about the graph being resolved, including where the Resolve() call originated and what components contributed to it. Don’t forget to de-select the Warnings and Errors signals, so that you can see information-level events.
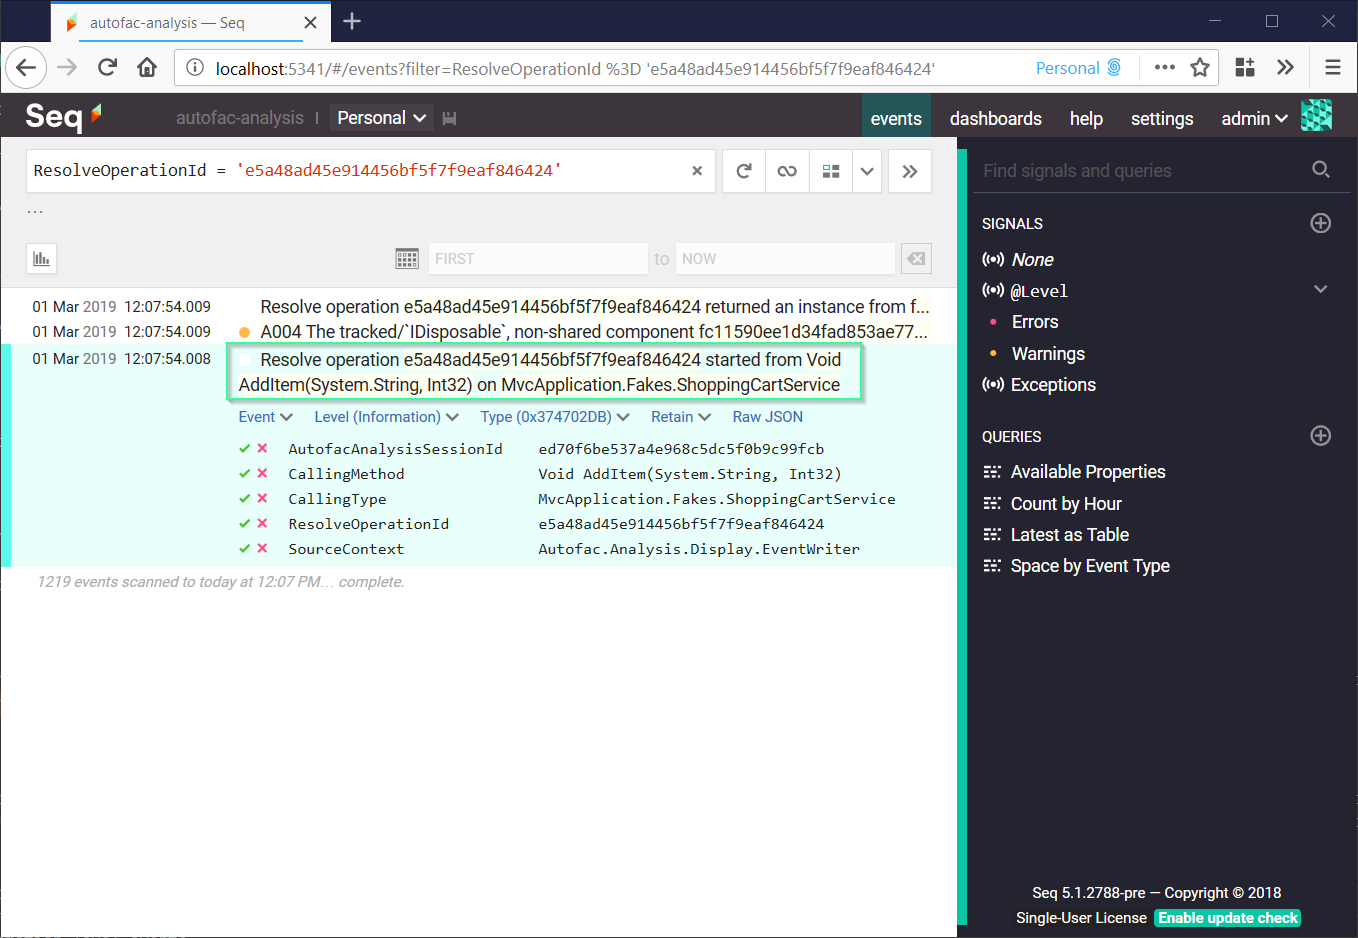
Here I’ve filtered on the ResolveOperationId to see where in the codebase it started. Here’s the ShoppingCartService.AddItem() method:
public class ShoppingCartService
{
    readonly Func<DBContext> _createDBContext;

    public ShoppingCartService(Func<DBContext> createDBContext)
    {
        _createDBContext = createDBContext;
    }

    public void AddItem(string itemId, int quantity)
    {
        Log.ForContext<ShoppingCartService>().Information("Adding {ItemId} x {Quantity} to cart", itemId, quantity);

        // Oops, this will leak, we really needed Func<Owned<DBContext>> here.
        using (var db = _createDBContext())
        {
            // Find and update the current shopping cart :-)
        }
    }
}
Classic mistake - using Func<T> where Func<Owned<T>> is required.
4. Getting help
It might be a few years old, now, but if you have problems with memory usage in Autofac, the primer is the place to start.
Autofac.Analysis is a bit of an experiment. While issue reports and PRs for the analysis engine are welcome, I can’t help with debugging any Autofac usage issues that it identifies, sorry. Don’t despair, though! You should be able to collect enough information from the analysis log to write a really detailed Stack Overflow post, and tagging it with autofac is usually sufficient to get the right eyes on it.
Hope this helps!
Aside… why is the code so badly overengineered? If you poke your head into the nblumhardt/autofac-analysis GitHub repository, you’ll find it’s a complex beast. The analyzer was originally a fully-out-of-process application, complete with a WPF user interface, that connected to the profiled app via named pipes (I’d hoped to package it as a Visual Studio plug-in at some point). The effort involved in building and maintaining it ended up too great, so the code was cut down to what we have today. There’s still a full “client side” object model that replicates what’s going on in the container, and a “transport” that connects the model asynchronously to container events. It’s true that I’d never go this far, starting from scratch with more modest goals, but there are some nice properties of this architecture, including resilience to accidental deadlocks, that makes it worth keeping around as a foundation for more complex analysis someday.