
Serilog Timings
TL;DR: I’ve just kicked off development of Serilog Timings, a tiny package that adds streamlined operation timings on top of Serilog.
Though there are a million ways to collect timing data from applications, it’s often very useful to include it in regular logs:
-
Logs are visible all the time, even in development, while there isn’t always a metrics server handy
-
Logs make it easy to trace individual timings back to the conditions and processes that caused them
-
Structured logs events already carry the contextual properties around which the timings can be sliced and diced
It will come as no surprise that there are already a few options for recording timing information through Serilog. At its most basic, System.Diagnostics.Stopwatch and a handwritten log event can suffice. I’ve used SerilogMetrics, which includes timings along with counters and gauges, and I’ve also written several hand-rolled implementations for various apps.
As I’ve done this, the picture of what I want from operation timings has become a lot clearer:
Limited noise - when timings are recorded, it’s easy to end up with a crowd of log events: one declaring the operation started and assigning it an identifier, one describing the operation with a bunch of app-specific data, and finally the event completing operation with the elapsed time. Serilog Timings was built with the goal of compressing all of this into a single event.
Natural messages - related to the first goal, I don’t really want generic “operation started” and “operation ended” messages in the log. Logs need to be optimized for human pattern recognition - the message printed by one operation should be visually distinct from any other so that they’re easy to pick out from a large body of text.
Stable event types - furthermore, the event type (essentially a hash of the message template) should be stable for a particular operation, regardless of whether the operation succeeded, failed, or completed with a custom result. Stable (and unique) event types make it much easier to find all instances of an operation, even though “successful” ones may vastly outnumber and hence obscure the unsuccessful ones.
A compact syntax, .NET Core support, LogContext integration, custom results, … okay, I’m particular in the extreme … you kinda get the picture :-)
I won’t promise it’s the last attempt I’ll ever make to cover all of this, but Serilog Timings ticks all of the boxes right now. Here’s how it’s used.
Once you’ve configured Serilog and installed the NuGet Package, wrap the code you want to time with a using block and describe the Operation:
using (Operation.Time("Submitting payment for {ClaimId}", claim.Id))
{
    // Timed code goes here...
}
When the using block is completed, an event will be written to the log that looks like this one:
11:20:01 [INF] Submitting payment for claim-41546 completed in 11.2 ms
The description of the operation is a regular Serilog message template, which Serilog Timings extends with " {Outcome} in {Elapsed:0.0} ms". The properties from the description, plus the Outcome and Elapsed properties, are all included on the event if it’s sent to a structured log collector.
The completion event and any other events written within the block will be tagged with an OperationId property as well, if the Serilog LogContext class is enabled.
Operation.Time() assumes the operation always succeeds, so the message will be identical regardless of whether or not an exception is thrown.
Operations that need to distinguish between timings for successful completion vs failures use Operation.Begin() and Complete():
using (var op = Operation.Begin("Saving invoice {Filename} to blob storage", filename))
{
    // Timed code goes here...

    op.Complete();
}
Successfully completing the operation will produce an event exactly like the one in the first example. If Complete() is not called on an operation started with Begin(), perhaps because an exception was thrown, then it will be logged as abandoned:
11:29:37 [WRN] Saving claim-41456 invoice INF_CX7890.pdf to blob storage abandoned in 30978.8 ms
Notice that although the Outcome property is "abandoned" instead of "completed", and the level is warning, the message template (and thus the event type) is identical to the one from the success case. This means that while completed and abandoned timings can still be differentiated, given one of them it’s always simple to find the other.
To bail out of an operation altogether and suppress the warning message, an operation can be Cancel()ed.
Complete() can optionally accept a result property name and value to added to the event, so for example if you’re timing a network request, you can tag the event with BytesReceived, running a SQL query you might tag the event with Rows and so-on. More detailed instructions and documentation are in the project README.
Events generated by Serilog Timings display nicely in log files or the console. If you collect logs using SQL Server or another database you might elevate the Elapsed property to column-level for some interesting analysis opportunities (the Serilog sink for SQL Server recently acquired property-to-column mapping capability).
This screenshot from Seq shows a timing event from my test app with all of its attached information:
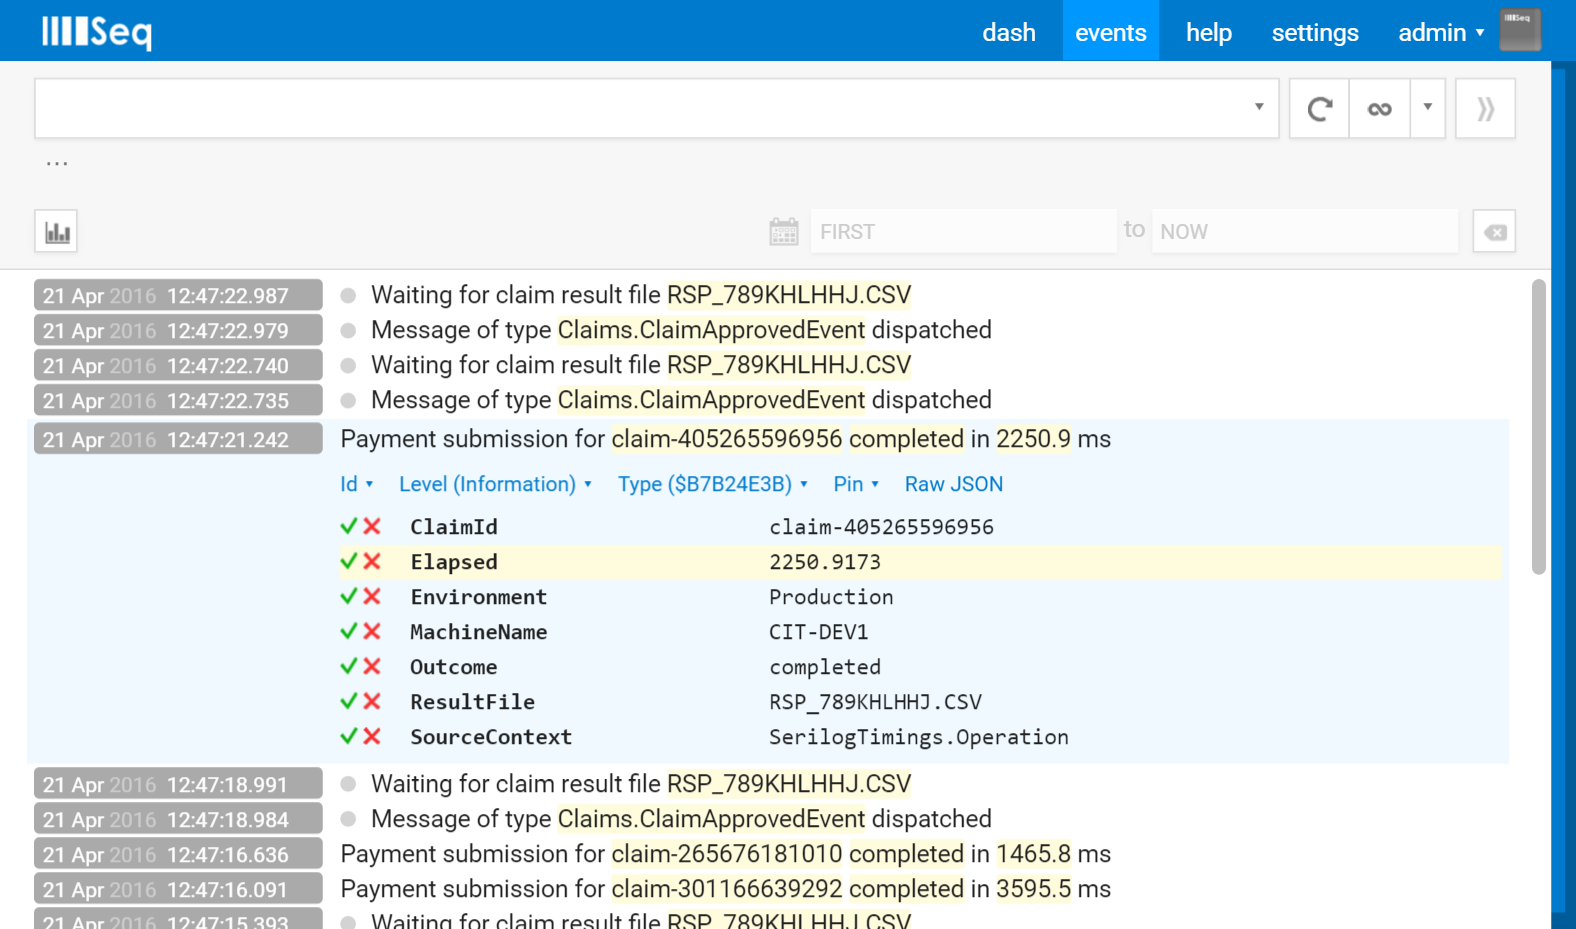
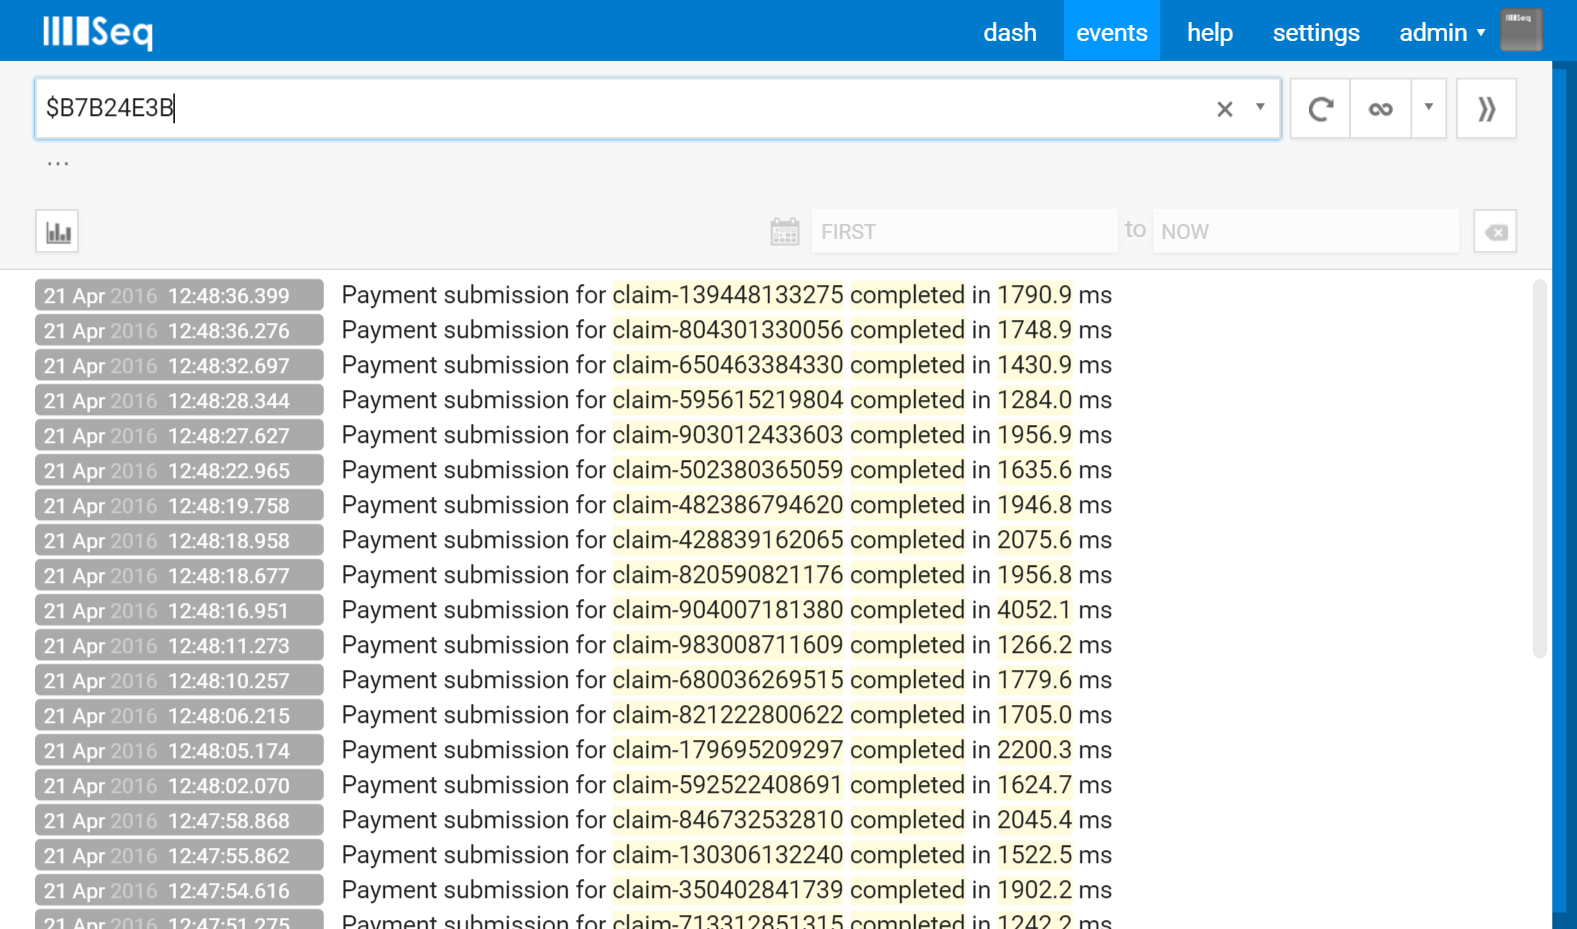
The stable event type (B7B24E3B shown as Type in the screenshot above) lets us drill down to just the timings of the operation we’re interested in:
And once we’ve pushed this over into a signal we can run more interesting queries to follow the Elapsed value over time:
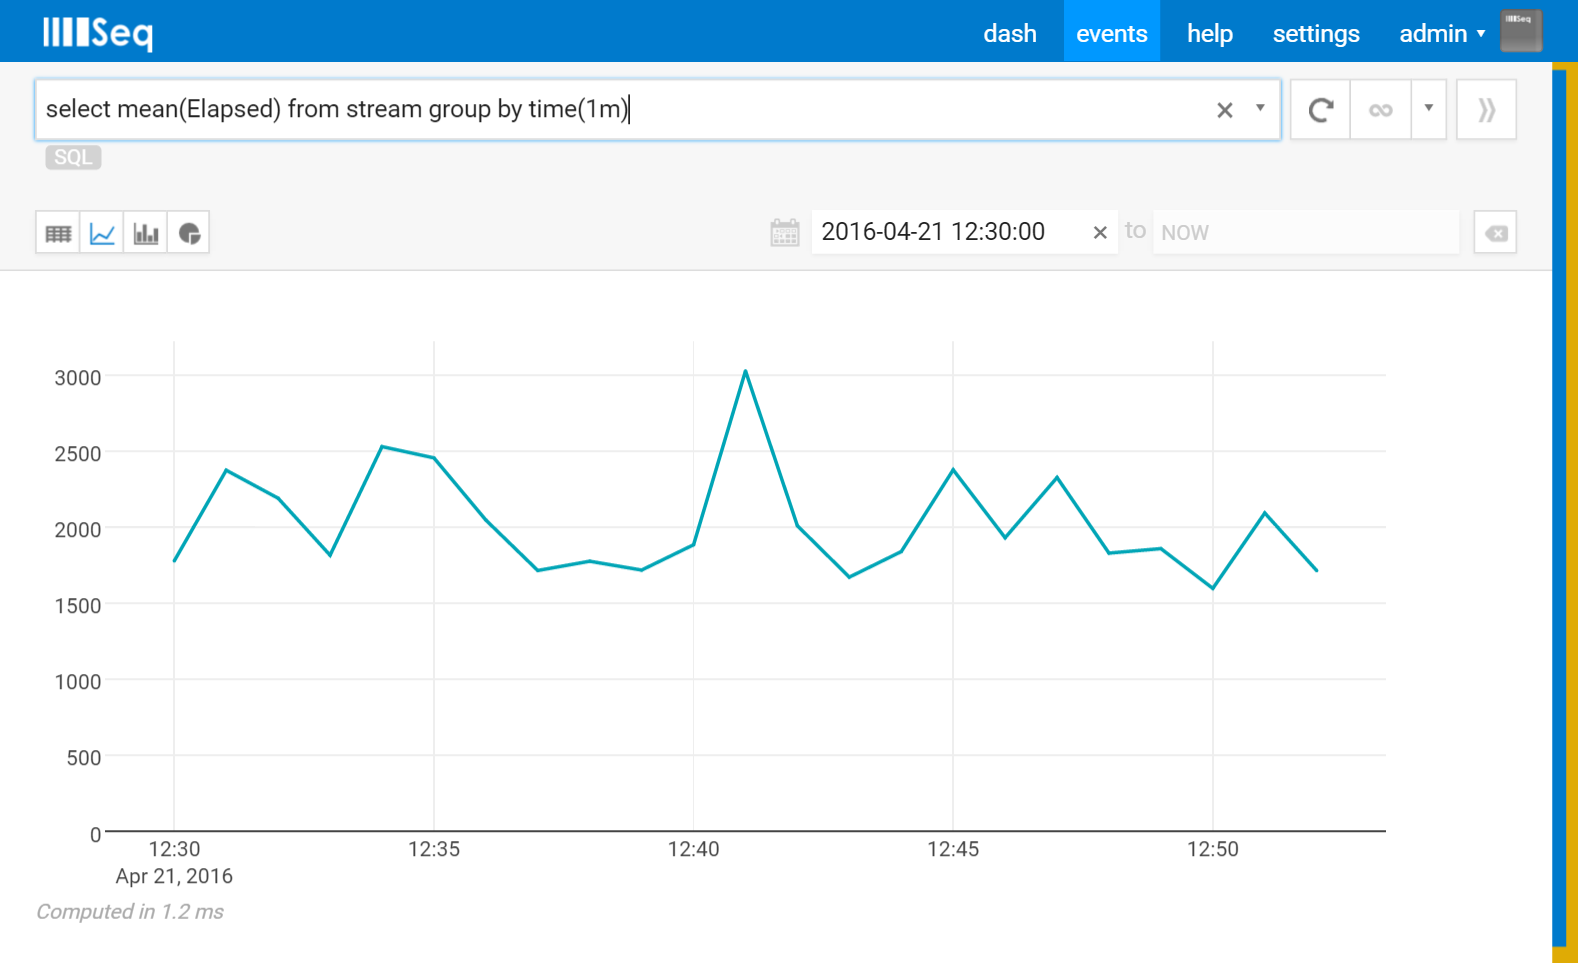
(Seq 3.1 just added the timeseries charting shown here, so my current obsession is trawling through historical log data to see what kinds of trends I can detect ;-) .)
What do you think? I’d love to hear from you if you give Serilog Timings a try, and issue reports or PRs to the GitHub project are welcome. Have fun!